Record a performance profile
When you have performance issues while using Motiff, such as slowness and lagging, you can use the Chrome browser's developer tools to record a video of the affected actions.
Recording a Chrome performance profile can help the Motiff technical support team quickly locate and troubleshoot the causes of performance issues.
Recording a performance profile
You can record a performance profile by following these steps:
- 1.Launch the Motiff desktop app or open a Motiff file in your browser.
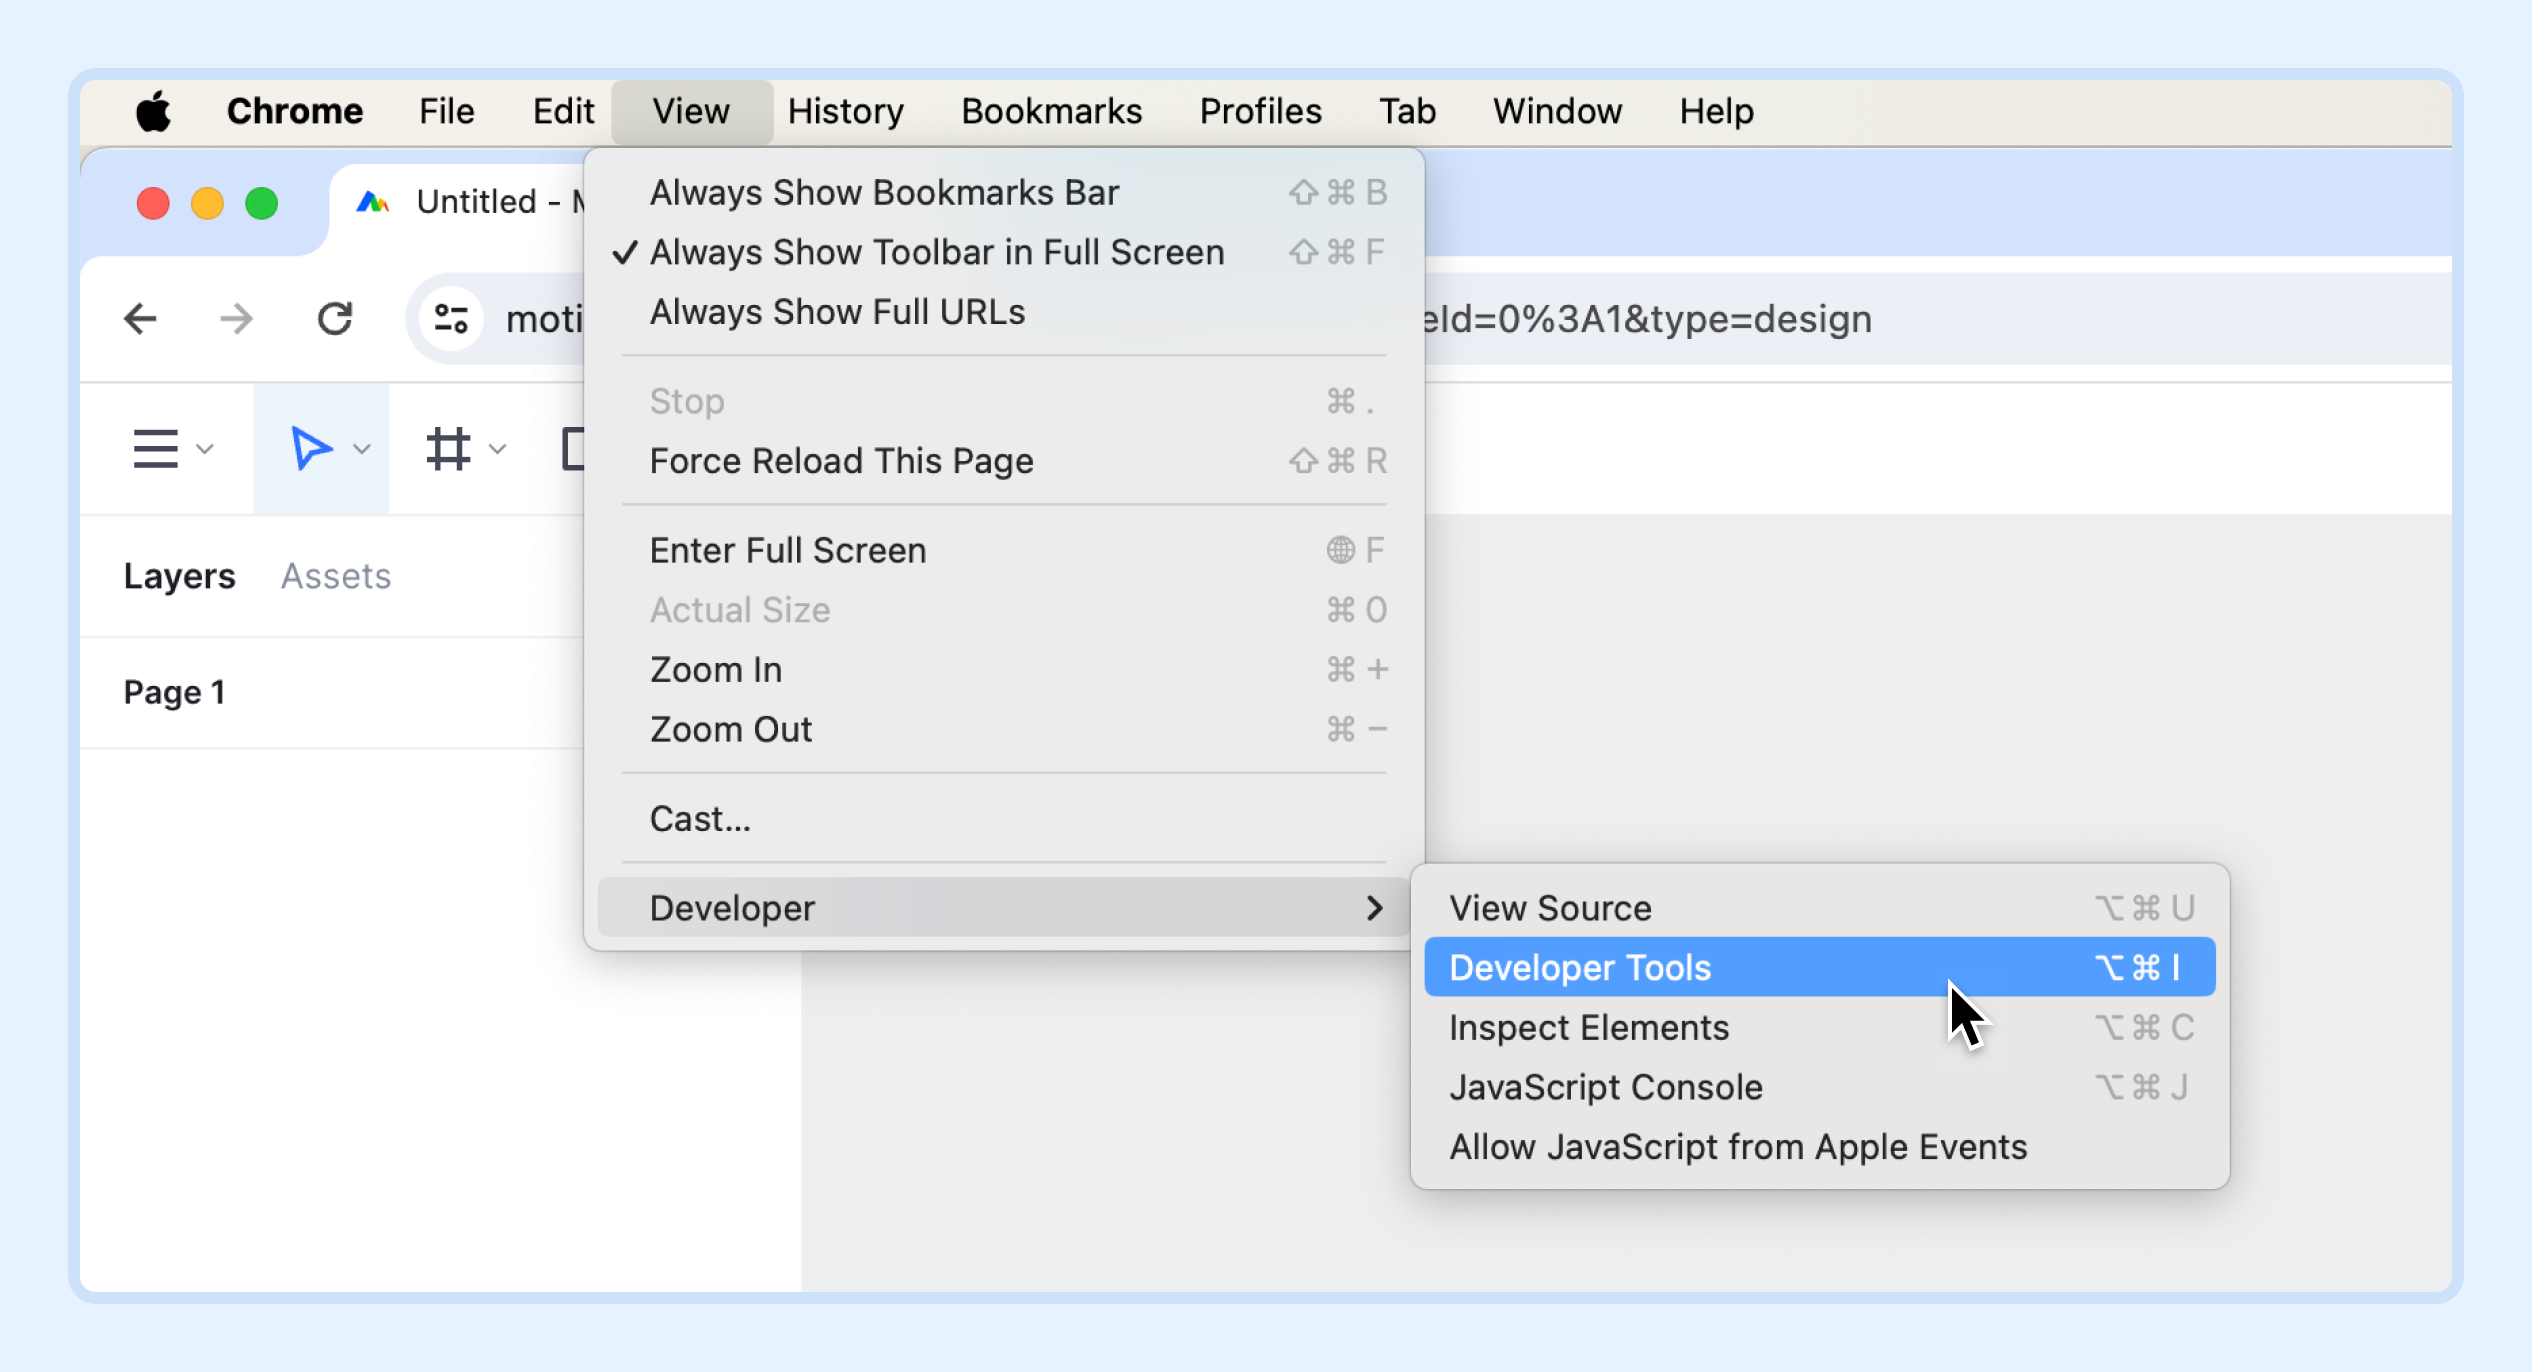
- 2.Click on View -> Developer -> Developer Tools in the toolbar.
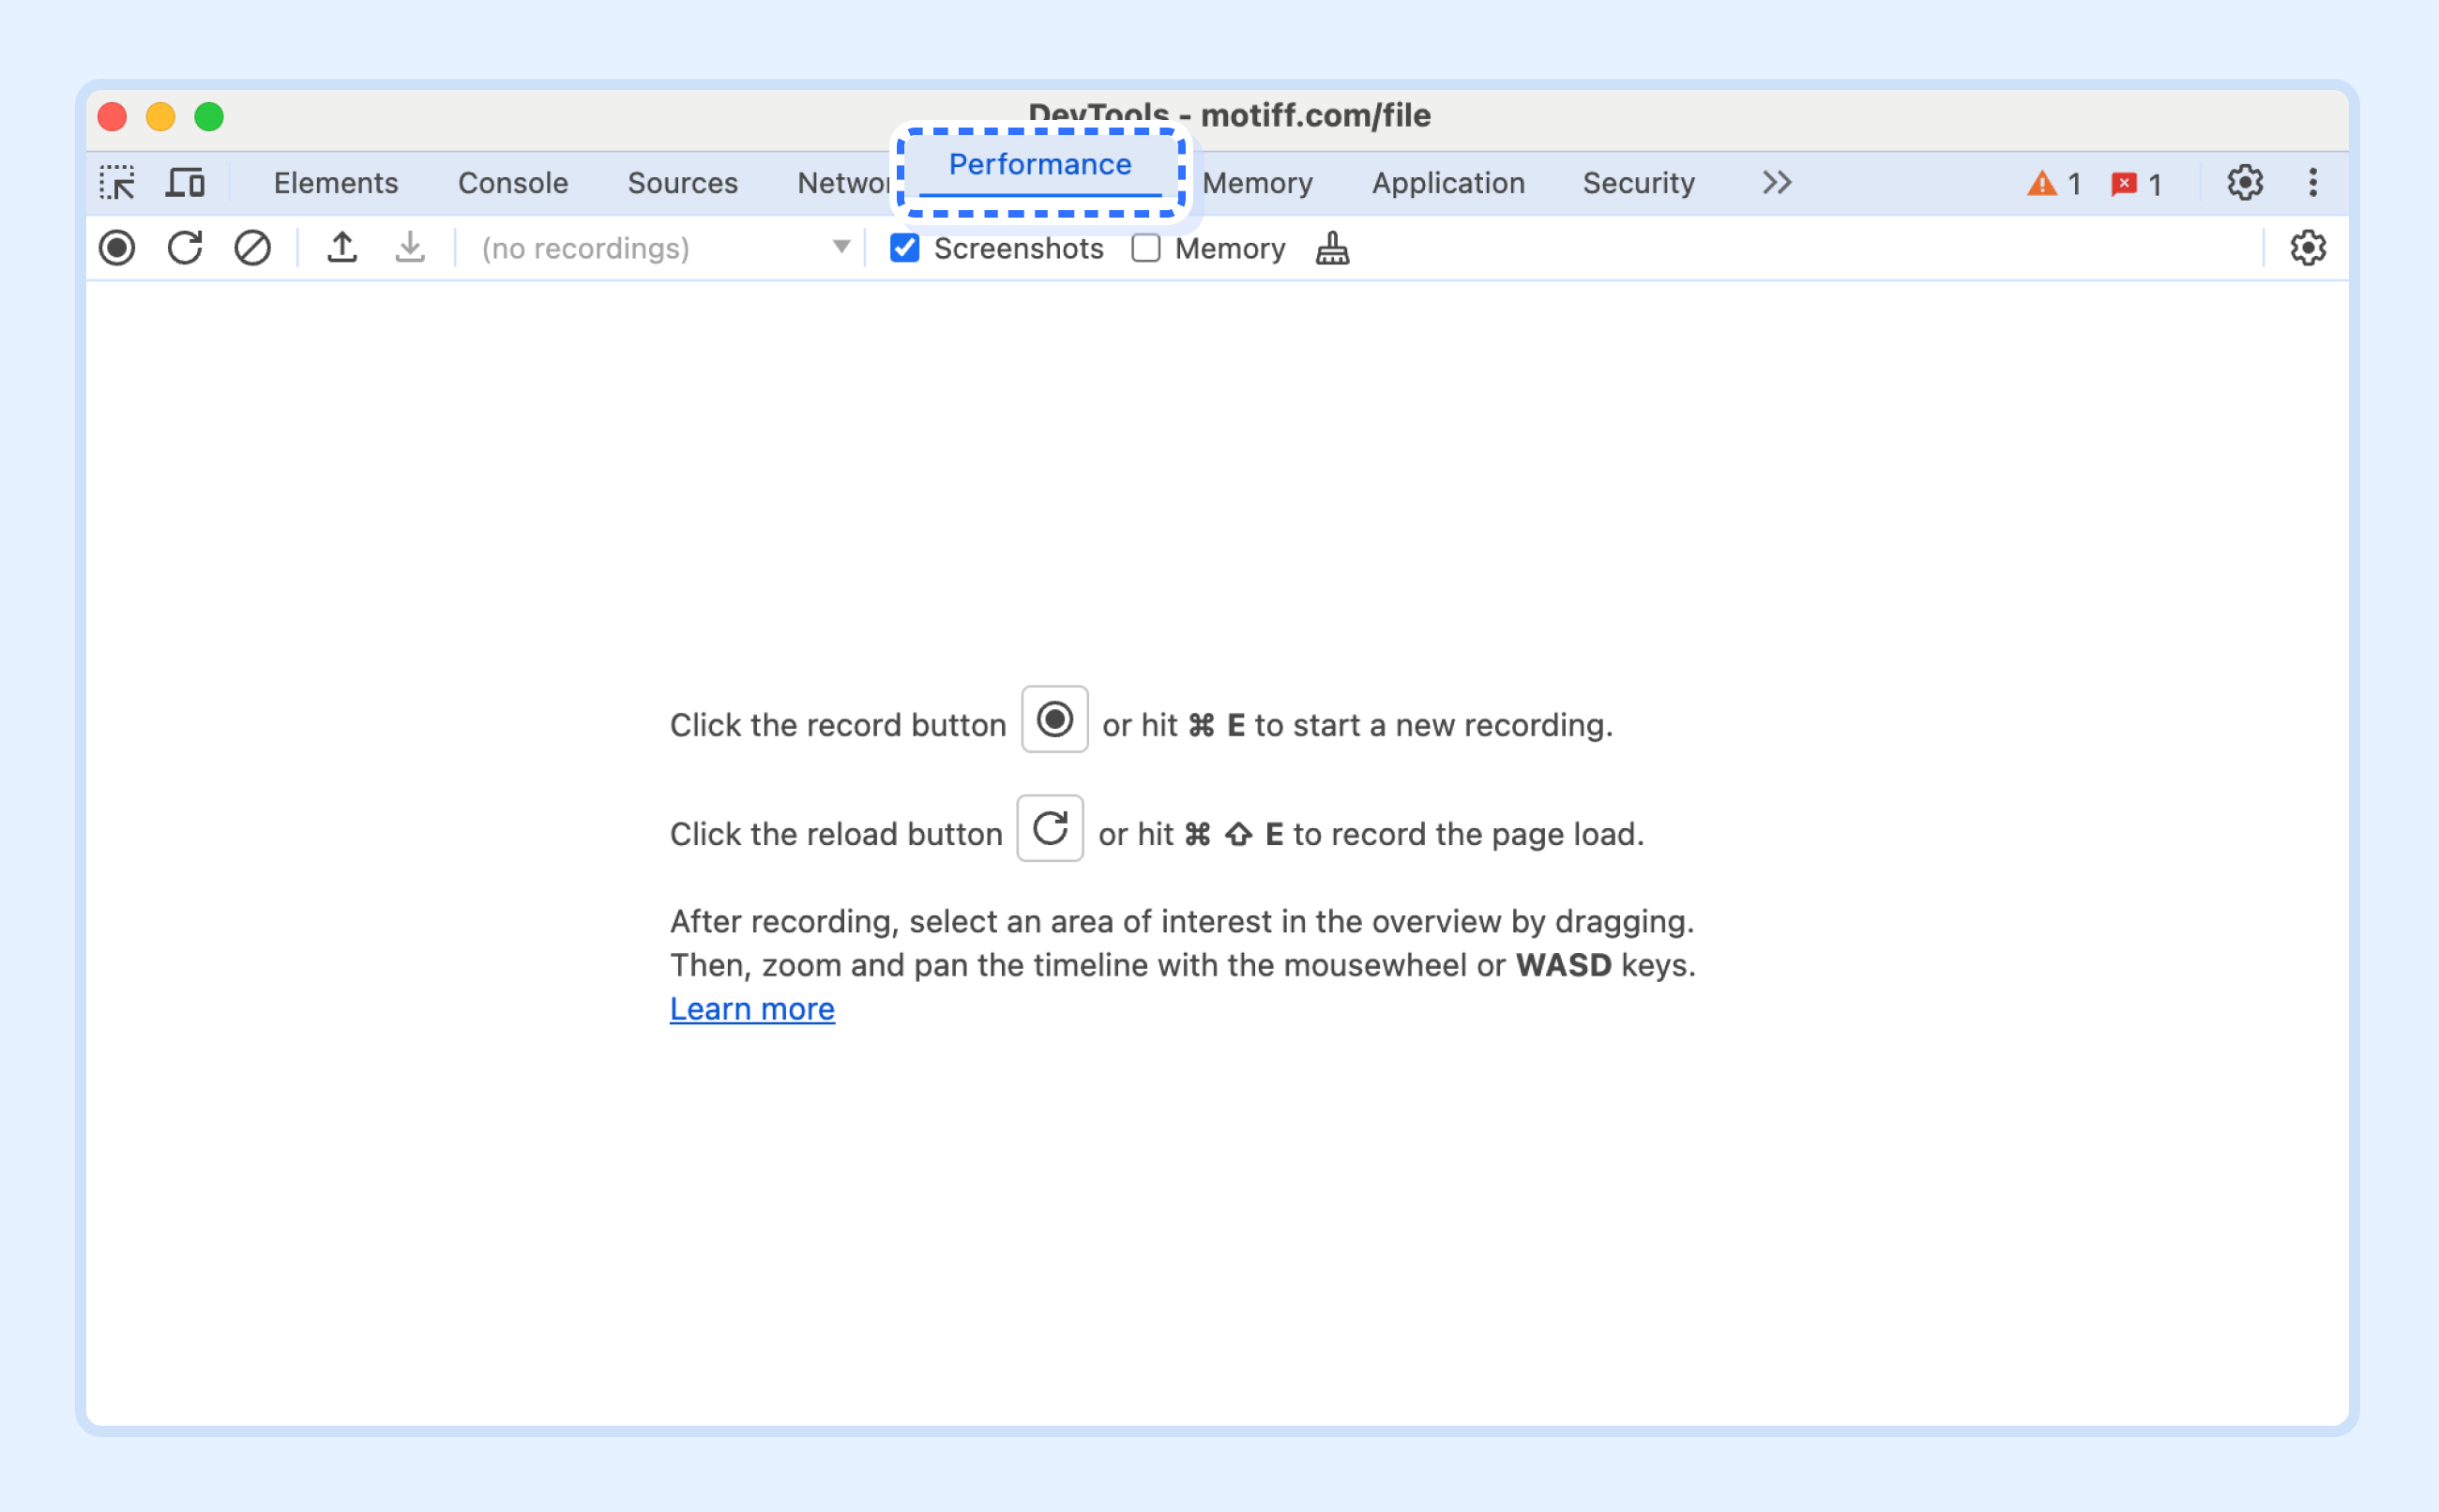
- 3.Once in the Developer Tools, select Performance.
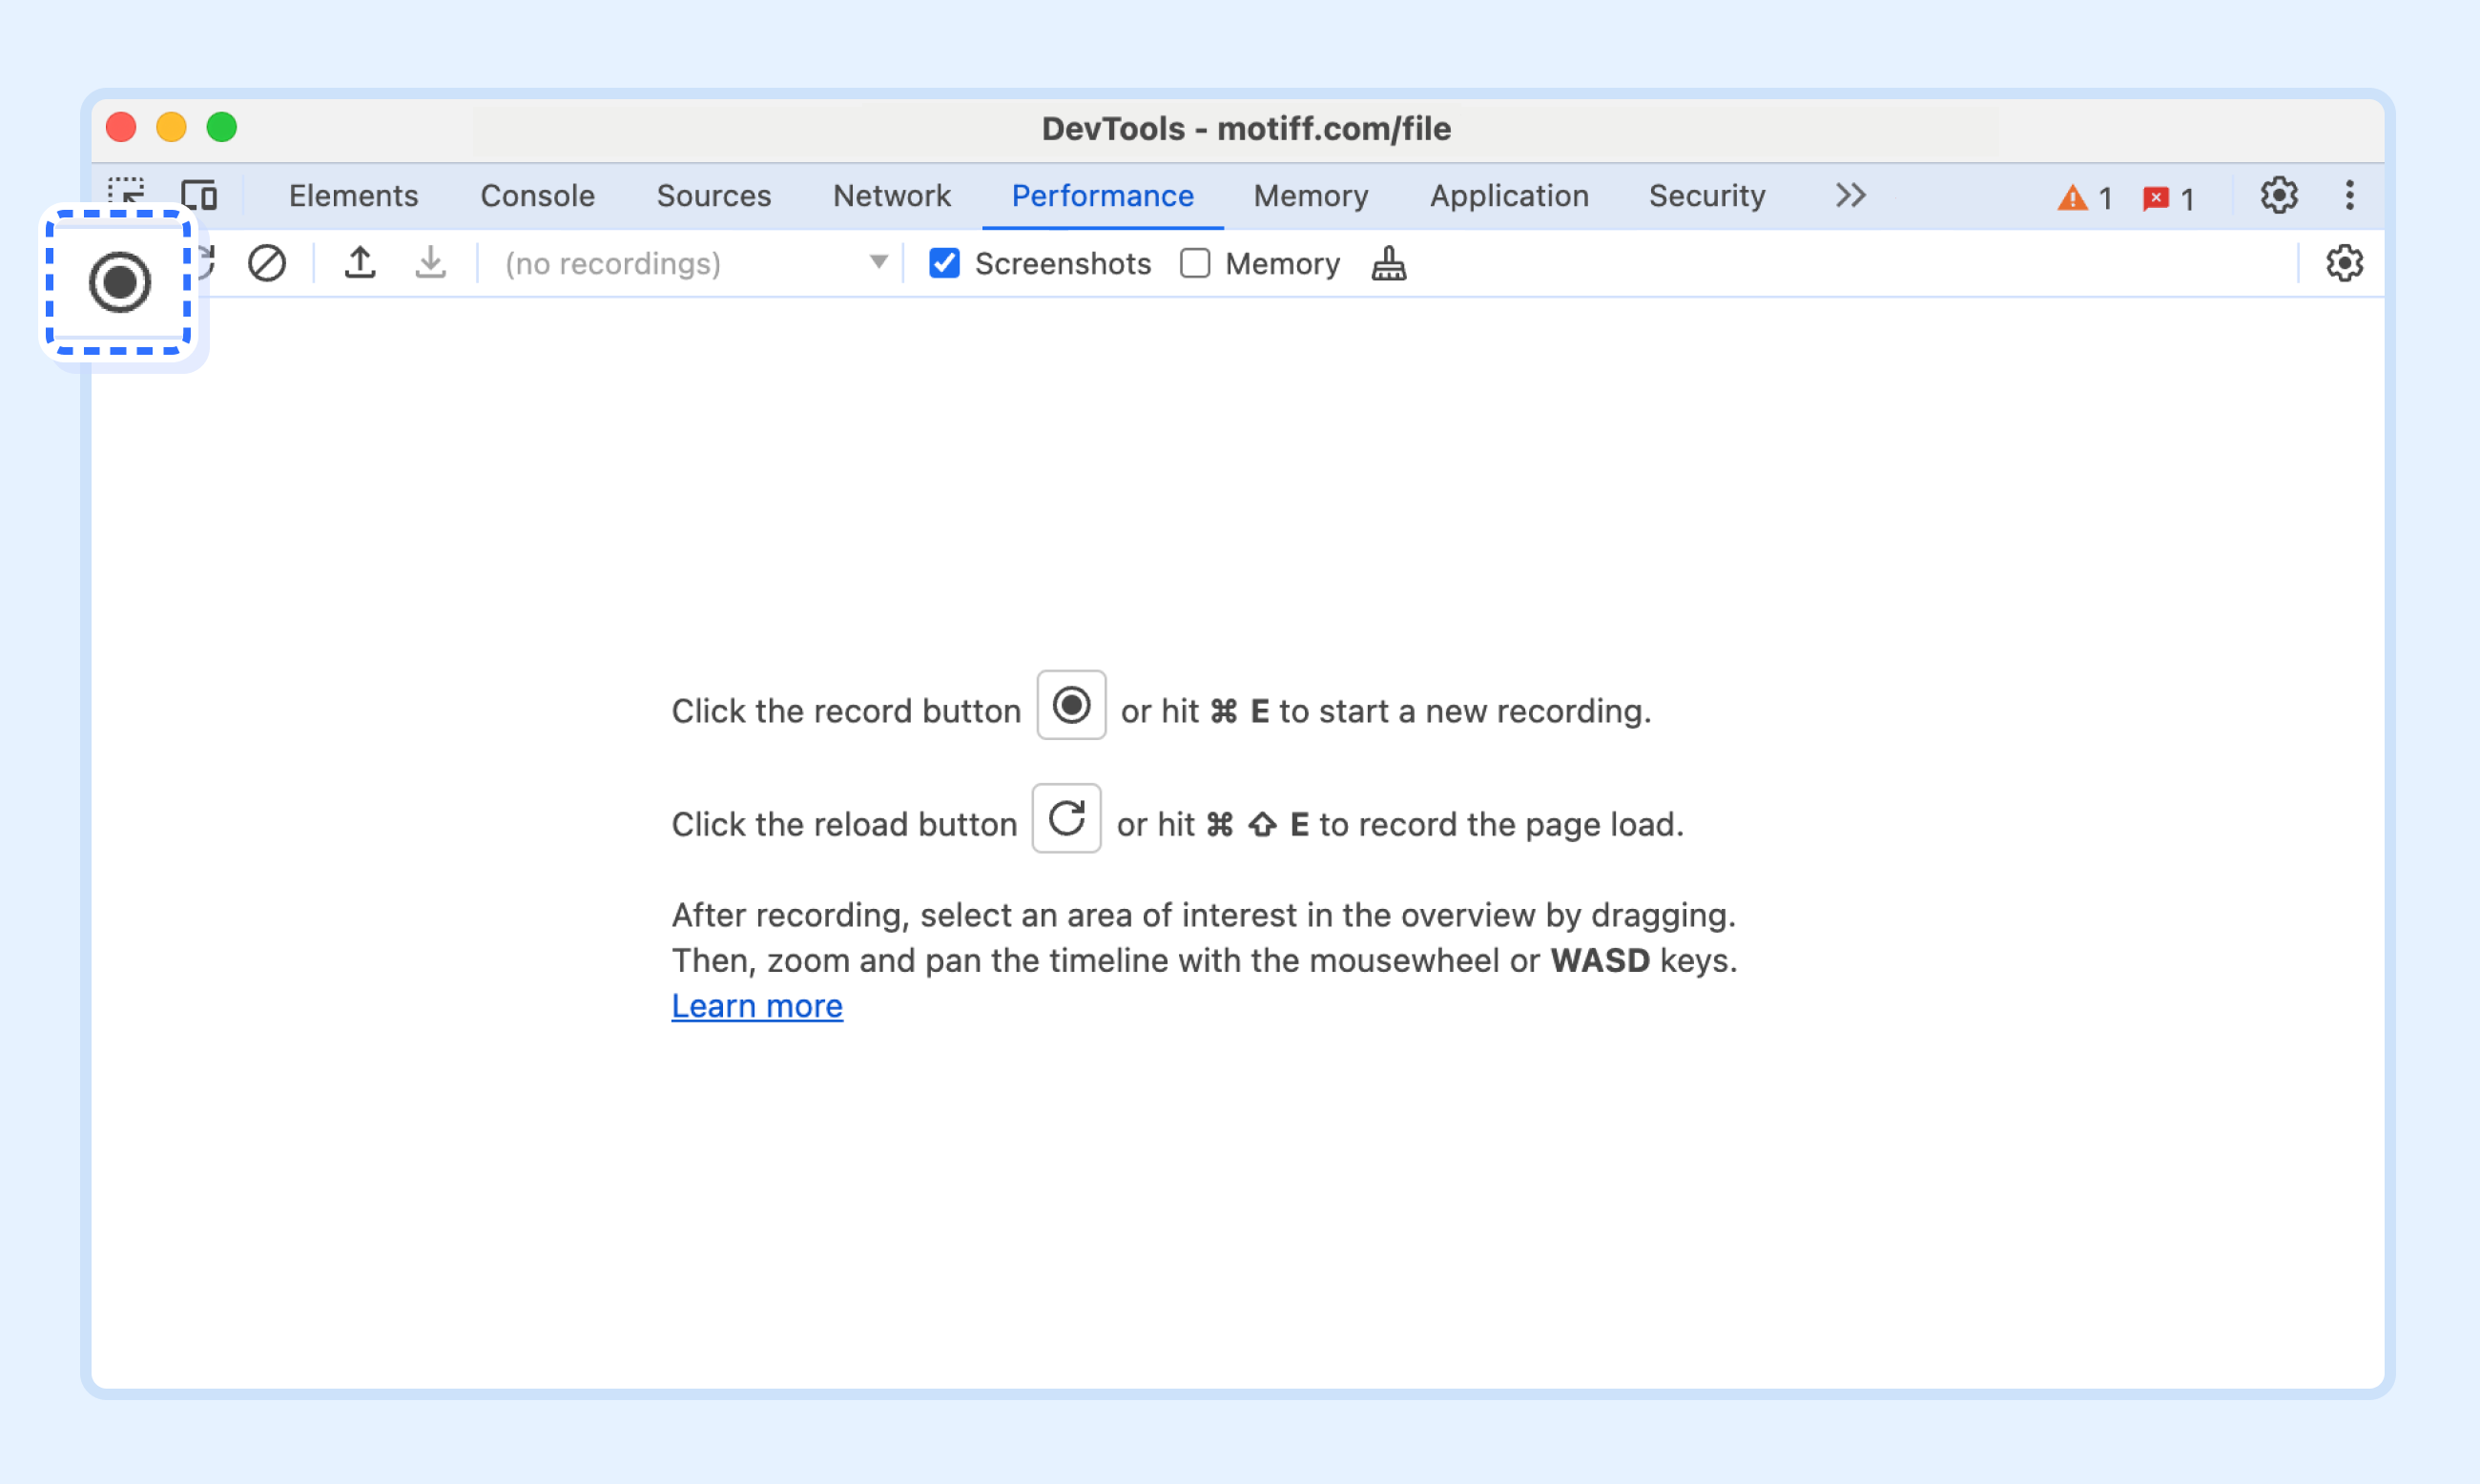
- 4.Click the Record button in the top left corner.
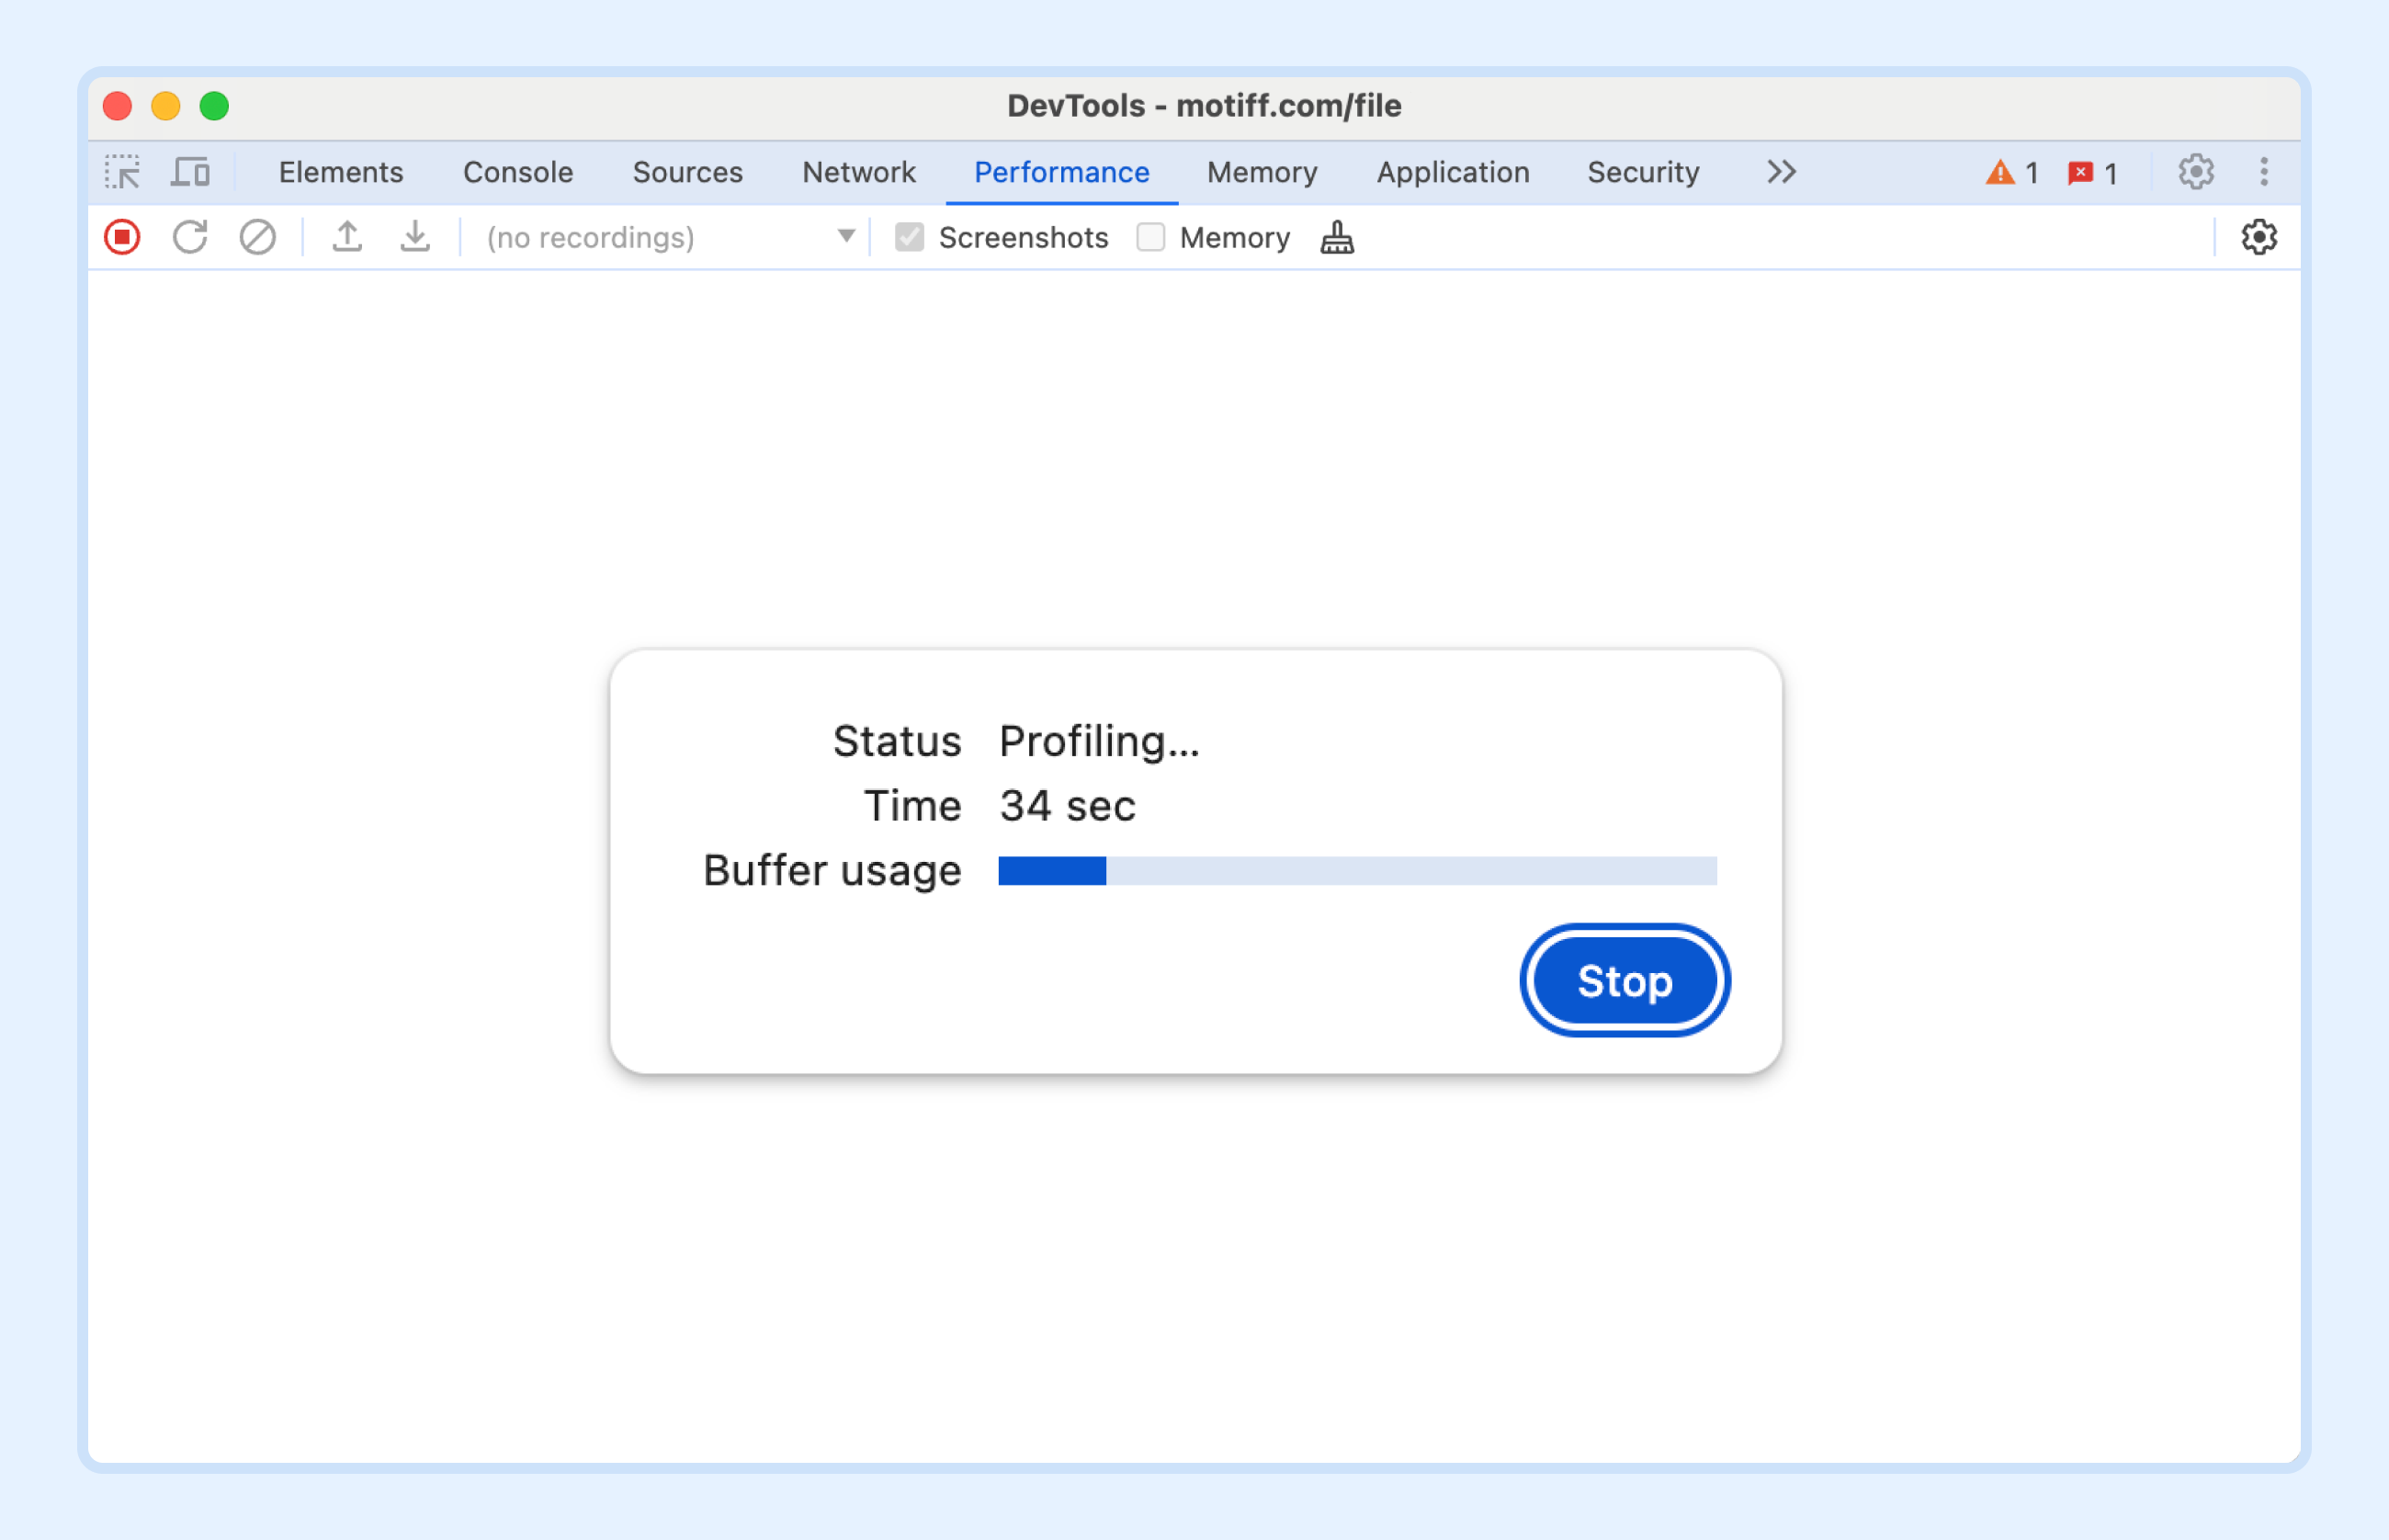
- 5.A progress bar will indicate that the performance profile is currently being recorded.
- 6.Return to Motiff and re-perform the operation that you previously had issues with.
- 7.After completing the operation, return to the Developer Tools window and click Stop to end the recording.
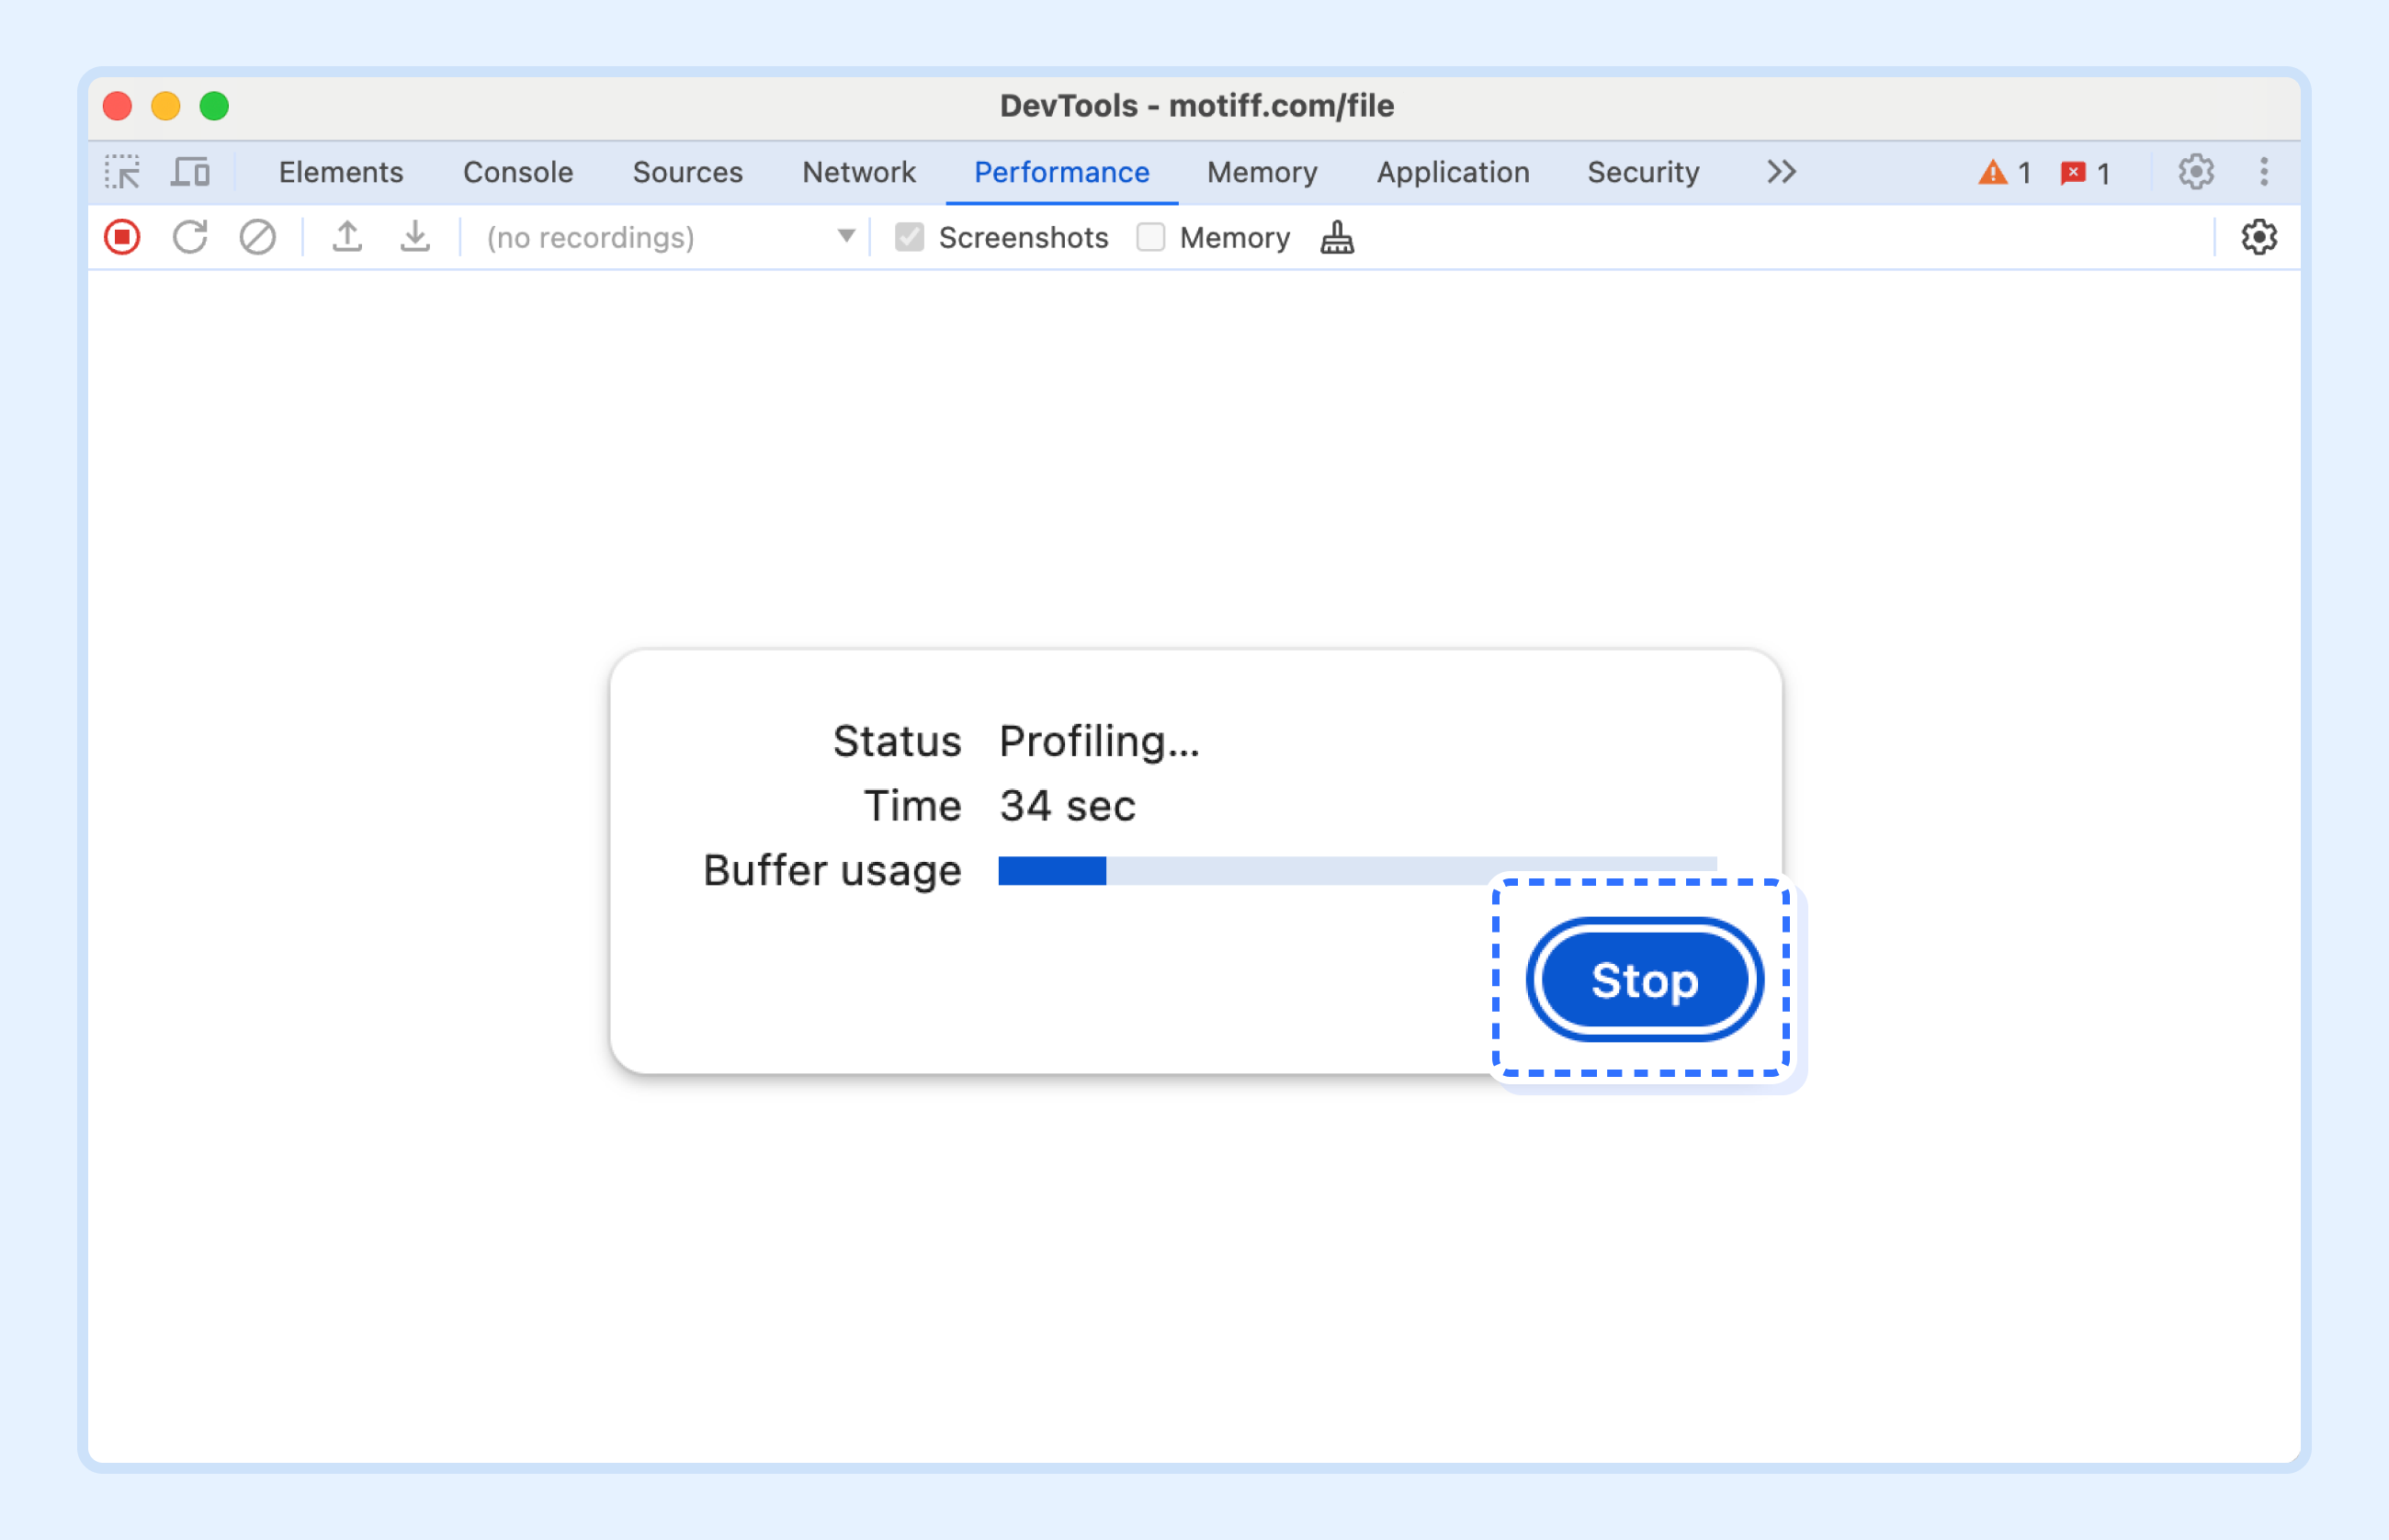
- 8.After stopping the recording, a detailed view of the current profile will be displayed in the window. You can adjust the timeline to view screenshots of each operation.
- 9.Right-click and select Save profile…, and the profile will be downloaded to your computer.
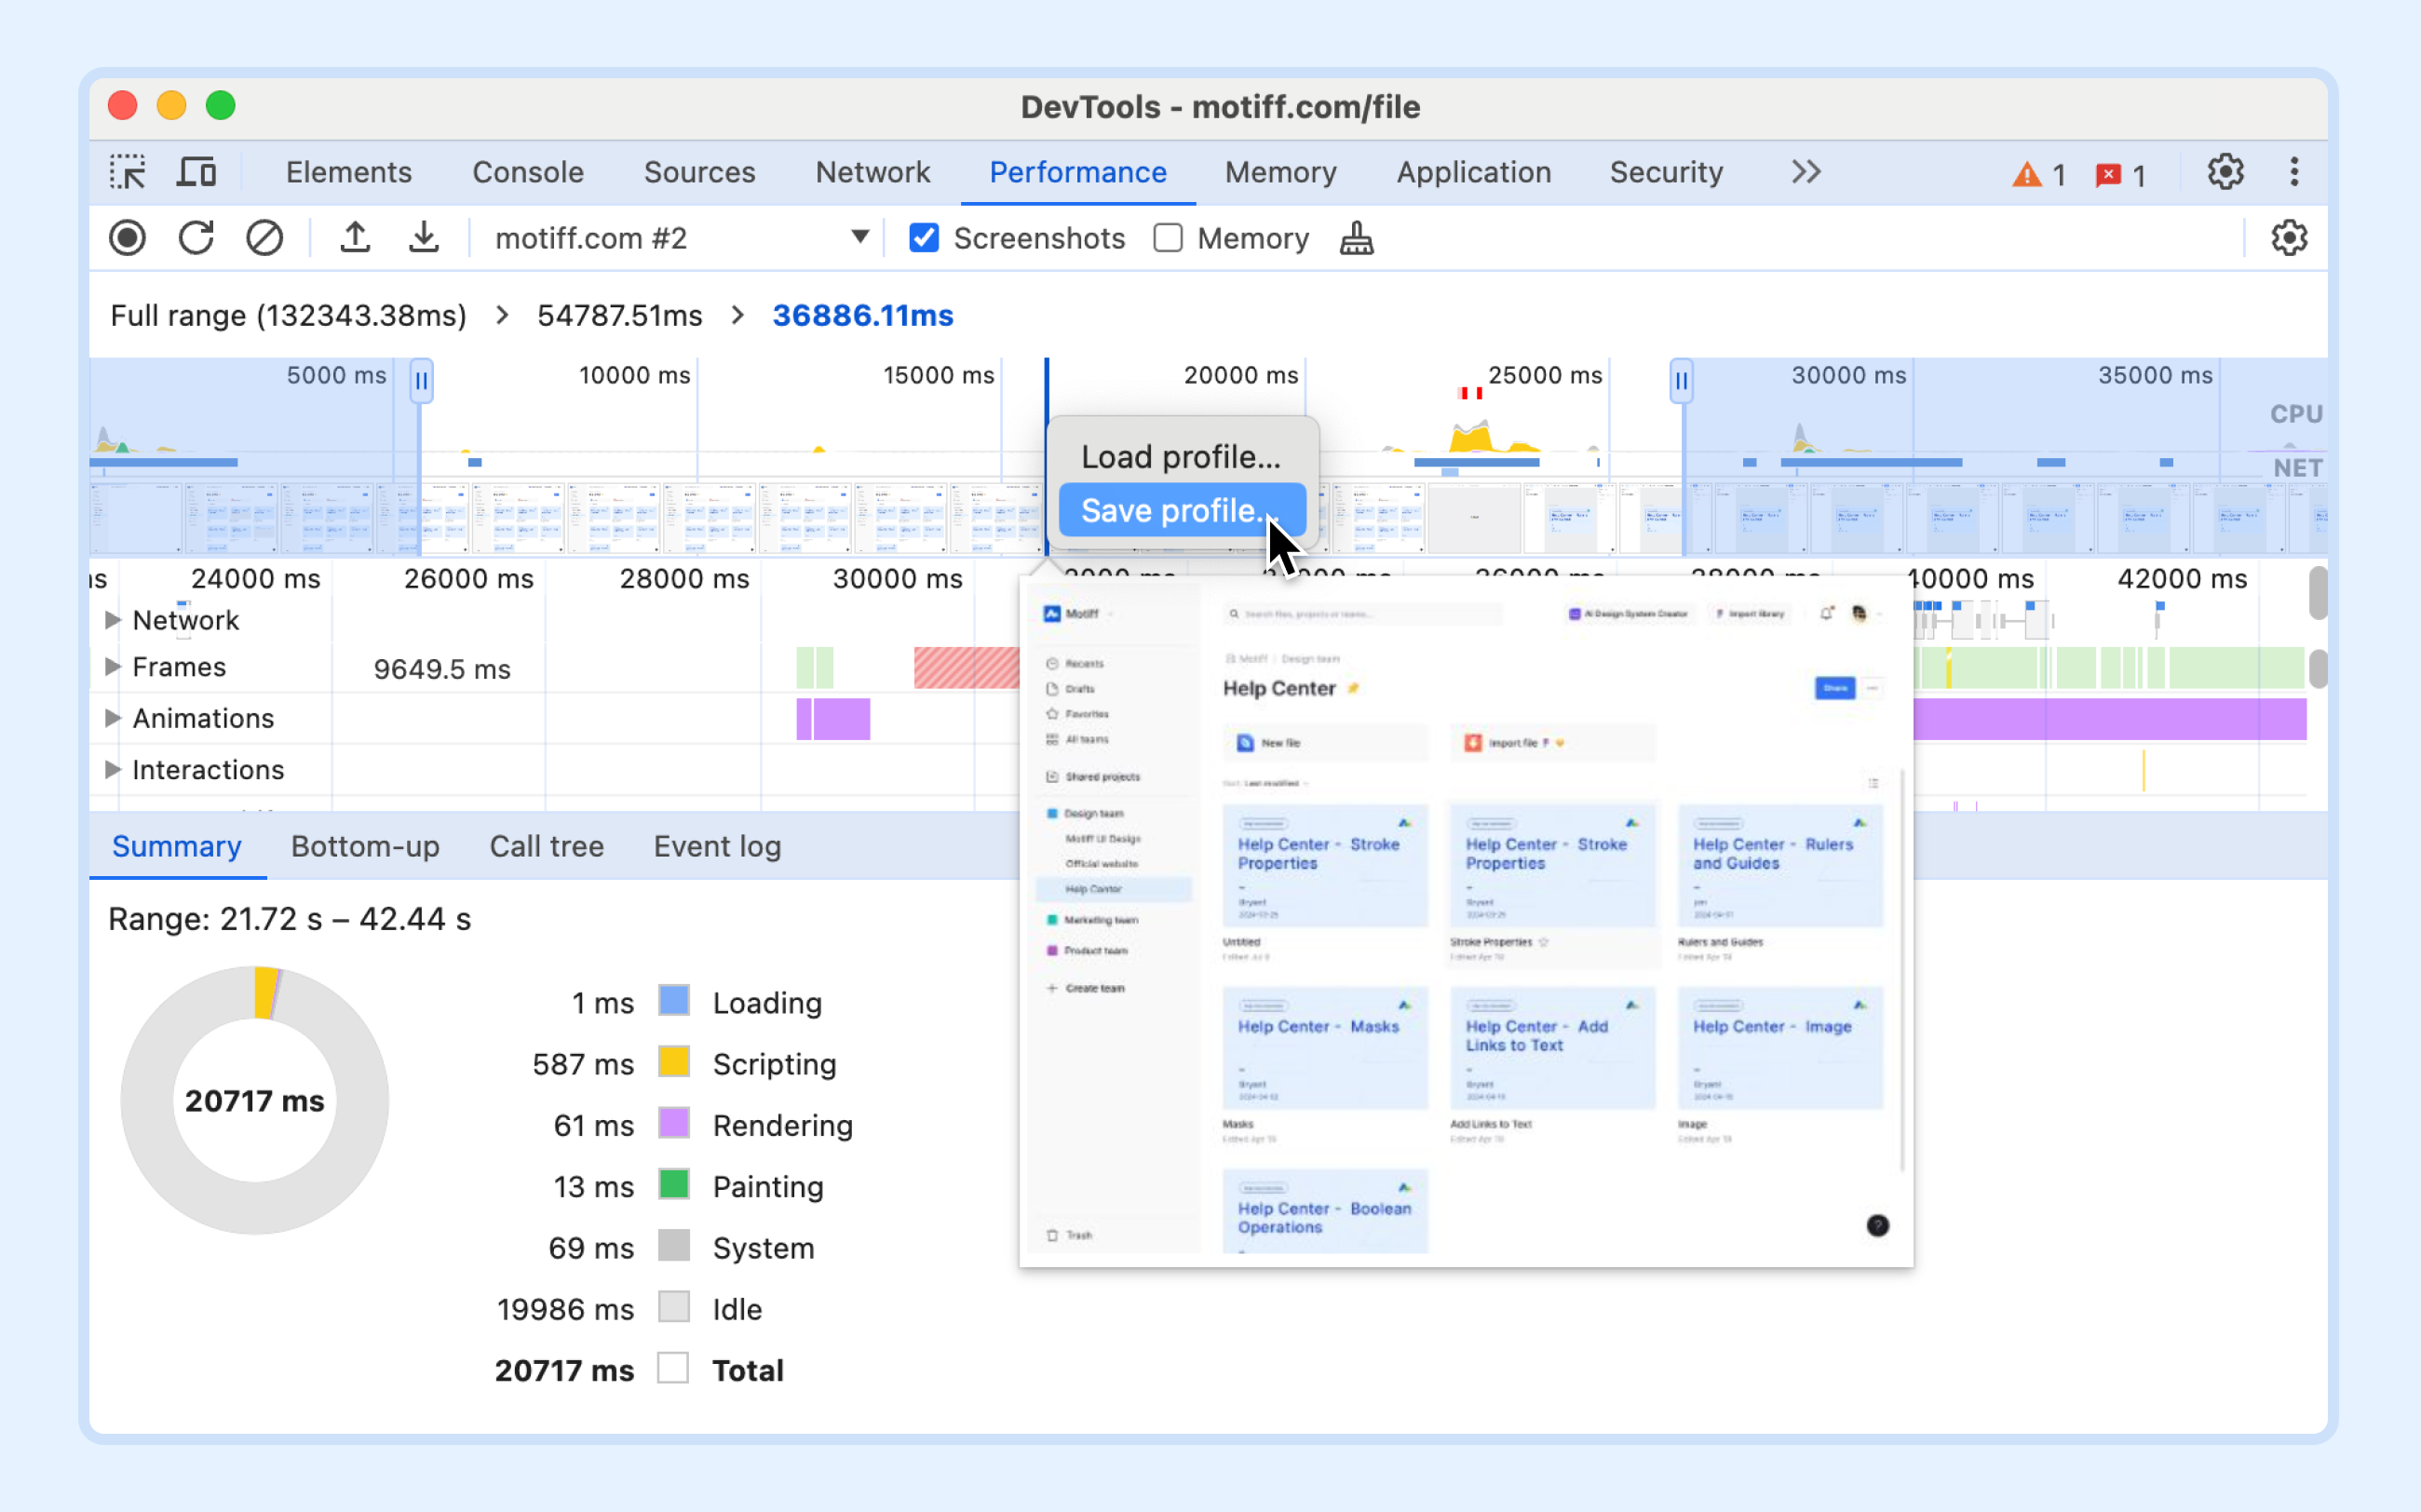
- 10.Provide the above error file and information to the Motiff team.
You can use shortcut keys to quickly start and stop the performance recording process:
- macOS: ⌘ Command + E
- Windows: Ctrl + E
If you need to submit a bug report, click here to learn 'How to submit a bug report'
